
- How would YOU interpret the ECG in Figure-1 ?
- Is this history helpful for making the diagnosis?
-USE.png) |
| Figure-1: The initial ECG in today's case. (To improve visualization — I've digitized the original ECG using PMcardio). |
- #1) Does the rhythm need immediate treatment? (as might be the case if the rhythm was excessively fast or slow).
- #2) IF the patient is hemodynamically stable and the rhythm does not need immediate treatment — I then take a brief look at the rest of the 12-lead ECG.
- The QRS in Figure-1 is obviously wide (clearly more than half a large box in duration).
- The ventricular rhythm is almost (but not completely) Regular — in that R-R intervals vary between being a little more or a little less than 5 large boxes in duration.
- The Rate of the rhythm is ~60/minute (300 ÷5 ~60/minute).
- Some P waves are present! That said — we do not see P waves throughout the entire tracing.
- The P waves that we do see, do not appear to be Related to neighboring QRS complexes (because the PR interval looks to be continually changing).
- We do not yet know about this patient's hemodynamic status. That said — a wide QRS rhythm at a rate of ~60/minute (even if this represents 2nd- or 3rd-degree AV block) — usually does not need immediate treatment.
- PEARL #1: As noted above — the QRS complex is wide. Whenever we detect that the QRS is wide — we want to determine as quickly as possible WHY is the QRS wide?
- Is QRS widening the result of some form of bundle branch block?
- — OR — Is this a ventricular rhythm?
- Why did YOU think the QRS is wide in Figure-1?
- #1) There is a supraventricular rhythm with some type of conduction disturbance (due to either aberrant conduction or preexisting bundle branch block). As reviewed in ECG Blog #204 — there are 3 basic types of conduction disturbances ( = RBBB, LBBB and IVCD).
- #2) There is WPW.
- #3) There is a ventricular rhythm.
- #4) There is some type of "toxicity" causing QRS widening.
- WPW is not present — as P waves are not conducted, and there are no delta waves.
- Aberrant conduction is most often seen in association with a rapid ventricular rate — and the heart rate here is not fast.
- QRS morphology does not resemble any known form of conduction disturbance (ie, There is no upright QRS in lead V1, as would be the case with RBBB — and the QRS is essentially all negative in all 3 inferior leads and in all 6 chest leads). This strongly suggests a ventricular rhythm.
- QUESTION: Did YOU notice peaking of T waves?
- ST-T waves look overly peaked (if not pointed) in multiple leads (ie, in leads II,III,aVF; and V3-thru-V6). The size of many of these T waves looks to be disproportionately increased with respect to the size of S waves in these leads.
- My Impression: This patient is almost certain to have significant Hyperkalemia — so much so, that I’d empirically give IV Calcium, even before knowing what the serum K+ level is.
- My discussion of a similar case in ECG Blog #275 reviews the textbook description for sequential ECG changes seen with progressive degrees of hyperkalemia. But many patients do not read the textbook — such that any sequence of ECG changes may be seen (including cardiac arrest prior to T wave peaking and QRS widening).
- Increased K+ release from cells as a result of injury sustained during surgery.
- Reduced urine output/acute renal insufficiency.
- Hypovolemia (that may have been present before surgery — or developed during surgery).
- Exogenous K+ load (ie, from blood transfusions).
- Rhabdomyolysis (from malpositioning of the patient during surgery).
- Use of K+-retaining medications just before or during surgery.
- Acidosis (which promotes redistribution of K+ from intracellular to extracellular compartments).
PEARL #3: Rapid recognition of Hyperkalemia is among the most important of skills for emergency providers to master. The reasons for this are simple:
- i) Hyperkalemia is potentially life-threatening.
- ii) There is an empiric treatment (ie, IV Calcium) that can be life-saving — and which should sometimes be given prior to lab confirmation of hyperkalemia. Cautious administration of IV Calcium is safe — and, not-to-promptly treat the patient risks losing the patient.
- iii) Not-to-recognize hyperkalemia as the cause of QRS widening, unusual rhythm disturbances and/or ST-T wave abnormalities — will lead you down the path of potentially serious misdiagnosis.
PEARL #4: Considerations regarding use of IV Calcium:
- IV Calcium works fast (ie, within 2-3 minutes) by an action that stabilizes myocardial membrane potential, thereby reducing cardiac membrane excitability provoked by hyperkalemia (and thereby protecting against cardiac arrhythmias). NOTE: IV Calcium does not cause intracellular potassium shift, and it does not facilitate elimination of this cation.
- Either Calcium Chloride or Calcium Gluconate can be used (10 mL given IV over 3-5 minutes with ECG monitoring). NOTE: The chloride form contains 3X the amount of calcium per 10 mL dose (10 ml 10% CaCl = 6.8 mmol Ca++ vs 10 ml 10% CaGlu = 2.3 mmol Ca++).
- IV Calcium should be repeated IF there is no effect (ie, narrowing of the QRS on ECG) after 5-10 minutes. More of the gluconate form may need to be given (since it contains less calcium).
- The duration of action of IV Calcium is only ~30-60 minutes — but this is more than enough time to allow other treatments to work.
- CaGlu can be given through a peripheral IV line. Because CaCl is more likely to cause tissue necrosis if there is extravasation — a central line is recommended (except if your patient is in cardiac arrest).
- Other treatments will often be needed (ie, Glucose/Insulin; Albuterol inhalation; Sodium Bicarbonate — and in refractory cases, hemodialysis) — but IV Calcium is the initial treatment of choice for life-threatening hyperkalemia.
- NOTE: IV Calcium is not indicated for the treatment of peaked T waves with a narrow QRS and reasonable rhythm — as this is not a life-threatening situation.
PEARL #5: Assessment of the rhythm with severe hyperkalemia is often difficult for several reasons (as summarized below in Figure-2):
- As serum K+ goes up — P wave amplitude decreases. Eventually — P waves disappear.
- As serum K+ goes up — the QRS widens.
- In addition to bradycardia — any form of AV block may develop. Therefore — Think of hyperkalemia in the presence of any bradycardia when the QRS is wide (even if there is no T wave peaking).
- Cardiac arrhythmias that develop in association with severe hyperkalemia often "do not obey the rules" — such that identification of a specific rhythm diagnosis may not be possible in patients with severe hyperkalemia.
- ANSWER: The ECG will look like there is a ventricular escape rhythm — or — like the rhythm is VT if the heart rate is fast.
PEARL #6: As we have just noted, with progressive hyperkalemia — P wave amplitude decreases until ultimately P waves disappear.
- Interestingly — the sinus node is often still able to transmit the electrical impulse to the ventricles in such cases, even though no P wave may be seen on ECG. This is known as a sinoventricular rhythm.
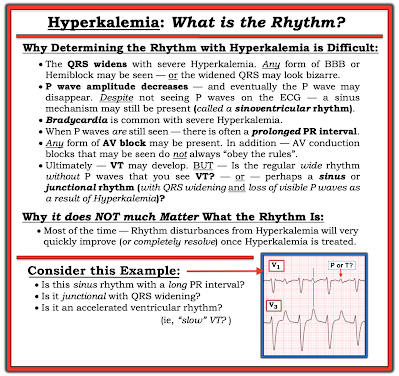 |
| Figure-2: Why assessing the rhythm with hyperkalemia is difficult. |
PEARL #7: In my opinion, it is not worth wasting time trying to figure out the specific rhythm diagnosis of a bradycardia when there is hyperkalemia. I used to spend hours trying to do this — but after years of doing so, I finally realized the following:
- i) That a specific rhythm diagnosis may not be possible when there is significant hyperkalemia — and, even if you succeed in making a diagnosis such as Wenckebach — chances are as serum K+ intra/extracellular fluxes change, that the cardiac rhythm will also soon change; and,
- ii) Clinically — it does not matter what the specific rhythm diagnosis is once you recognize hyperkalemia that needs to be immediately treated — because usually within minutes after giving IV calcium, the "bad" rhythm will most probably "go away" (often with surprisingly rapid reestablishment of sinus rhythm).
==============================
What about the Rhythm in Today's CASE?
Let's return to today's ECG. We determined in Figure-1 (that I reproduce below) — that the rhythm is fairly (but not completely) regular, at an average rate of ~60/minute — with at least some P waves, albeit these P waves do not appear to be related to neighboring QRS complexes.
- KEY Point: QRS morphology in Figure-1 does not resemble any known form of conduction defect (ie, the all-negative QRS across the 6 chest leads suggests that the wide QRS represents a ventricular rhythm).
- Are there additional P waves that are hidden in Figure-1?
|
| Figure-1: I've reproduced the initial ECG in today's case. |
- Set your calipers to this P-P interval suggested by the distance between 2 consecutive RED arrows.
- Note in Figure-3 — the partially hidden PINK arrow P wave that precedes the 4th and 5th RED arrow P waves. These last 3 colored arrows suggest what the P-P interval might be for a fairly (but not completely) regular underlying sinus rhythm.
-labeled-P-USE.png) |
| Figure-3: I've identified those P waves that we definitely see ( = the RED arrows). To this, I've added a PINK arrow for what appears to be a partially hidden P wave. |
-labeled-maybe-USE.png) |
| Figure-4: Colored arrows suggest an underlying sinus arrhythmia. |
- That said, when AV block is truly "complete" — the ventricular escape rhythm tends to be more regular than what we see in Figure-4. Most of the time — QRS complexes that appear earlier-than-expected are the result of some conduction (therefore 2nd-degree instead of 3rd-degree AV block).
- BOTTOM Line: None of this matters clinically! It is simply not worth wasting time trying to distinguish between 2nd-degree vs 3rd-degree AV block in Figure-4 — because arrhythmias often "do not obey the rules" when there is significant hyperkalemia — and the rhythm will probably normalize within minutes of giving IV Calcium.
==================================
Acknowledgment: My appreciation to Ahmed Marai, Safen Haider, and Zahraa Ali (from Iraq) — for allowing me to use this case and these tracings.
==================================

-ECG_Guru-USE.png)
-USE.png)
-labeled-USE.png)
-USE.png)
-USE.png)


-USE.png)
-USE.png)
-USE.png)
-USE.png)
-USE.png)
-USE.png)